See Hup Seng
Investor Relations
 Financial Summary
Half Year Results Ended 30 June 2025
Financials Archive![]() Note: Files are in Adobe (PDF) format.
Note: Files are in Adobe (PDF) format.
Please download the free Adobe Acrobat Reader to view these documents.
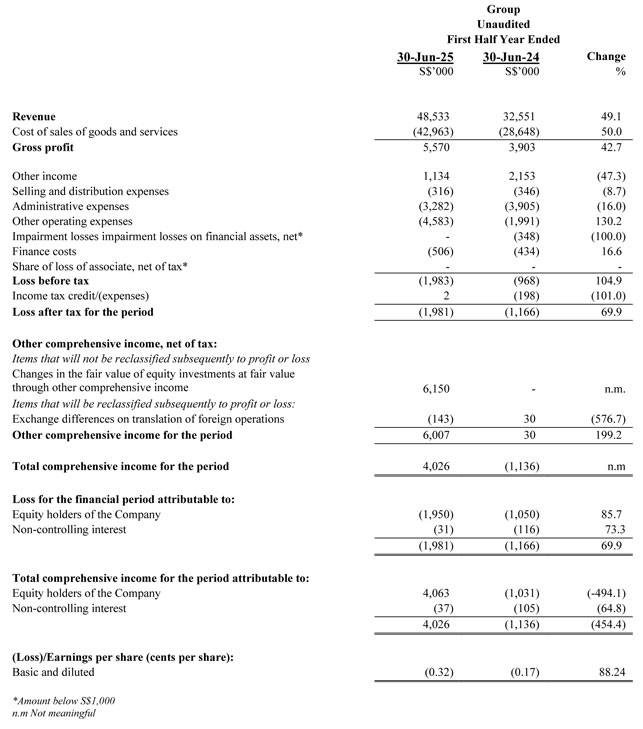
Condensed Interim Consolidated Statement of Profit or Loss and Other Comprehensive Income
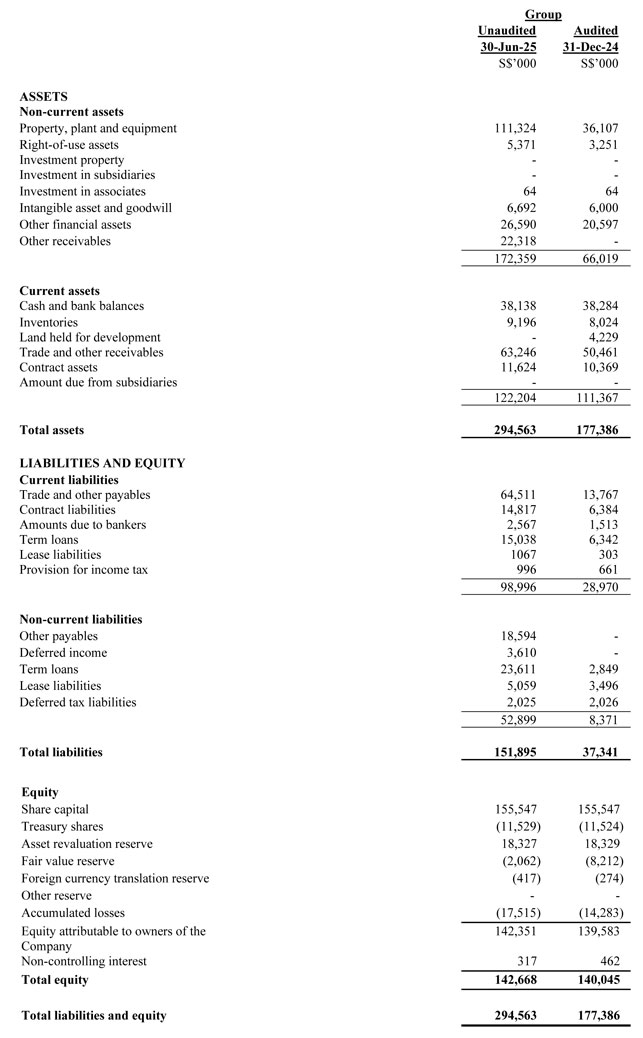
Condensed Interim Statements of Financial Positions
Review of performance of the Group
Overview
For the half-year ended 30 June 2025 (“1H25”), the Group reported a significant 49.1% year-on-year increase in revenue to S$48.5 million, compared to S$32.6 million in 1H24. This performance was primarily driven by higher revenue contributions from the Engineering & Construction and Commodities segments. In particular, the Commodities segment recorded a substantial increase in revenue to S$17.2 million in 1H25 (1H24: S$1.7 million), due mainly to revenue contribution from the newly acquired Tidal companies in China which engaged primarily in precision aluminum manufacturing and aluminum recycling businesses.
Despite the increase in revenue, the Group's profitability was adversely impacted, recording a net loss attributable to equity holders of S$1.95 million in 1H25, compared to a net loss of S$1.2 million in 1H24. The decline was primarily driven by non-operating factors, most notably the weakening of the USD against the Singapore Dollar as compared to 31 December 2024, which negatively affected the foreign exchange translation of the Group's USD-denominated financial assets.
As at 30 June 2025, the Group's total equity was S$142.3 million, compared to S$140.0 million as at 31 December 2024.
Condensed Interim Consolidated Statement of Profit or Loss and Other Comprehensive Income
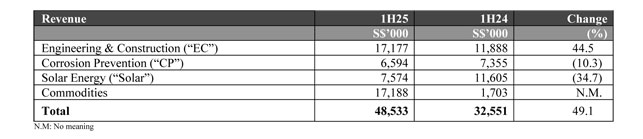
EC Segment
The Engineering & Construction (EC) segment grew by 44.5% to S$17.2 million in 1H25 (1H24:S$11.9 million), driven by improved project execution and higher revenue recognition from work completed during the period. Revenue in 1H24 was impacted by the scheduling of several new projects, which only commenced in July 2024, thus falling outside the 1H24 reporting period.
CP Segment
Revenue for the Corrosion Prevention (CP) segment decreased by 10.3%, falling to S$6.5 million in 1H25 from S$7.4 million in 1H24. The decline was primarily driven by a reduction in orders for site and blasting jobs.
Solar Segment
Revenue for the Solar Energy segment was S$7.6 million in 1H25, down from S$11.6 million in 1H24, primarily due to timing differences in project execution. Nevertheless, the segment continues to benefit from steady and on-going contributions from EPC projects.
Commodities segment
Revenue for the Commodities segment increased significantly mainly due to contributions from the newly acquired China subsidiaries.
Gross Profit and Gross Profit Margin
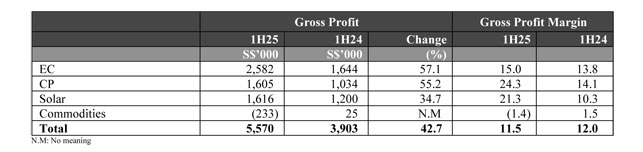
The Group's gross profit increased by 42.7%, rising from S$3.9 million in 1H24 to S$5.6 million in 1H25, reflecting overall revenue growth, whereas gross profit margin declined 50 basis points to 11.5% driven by substantially higher gross margin from EC, CP and Solar segments offset fully by negative gross margin from the Commodities segments.
EC segment
Gross profit for the EC segment increased by 57.1%, from S$1.6 million in 1H24 to S$2.6 million in 1H25. This improvement was driven by higher revenue, supported by progressive project executions. Gross margin % increased by 120 basis point to 15.0% due to higher margin jobs earned during the period offset partly by rising overheads, subcontractor fees and labour costs.
CP segment
The CP segment's gross profit rose by 55.2%, from S$1.0 million in 1H24 to S$1.6 million in 1H25, alongside a significant margin expansion from 14.1% to 24.3%. This was attributed to effective cost management initiatives and improved pricing strategies, despite ongoing competitive pressures within the shipyard sector.
Solar segment
The Solar segment recorded a gross profit increase of 34.7%, rising to S$1.6 million in 1H25 from S$1.2 million in 1H24. This was driven by improved cost controls and project execution efficiencies, resulting in a marked improvement in gross profit margin from 10.3% to 21.3%, despite a decline in segment revenue.
Commodities segment
The Commodities segment reported a gross loss of S$0.2 million in 1H25, compared to a marginal gross profit of S$25,000 in 1H24. This loss was primarily due to increased cost pressures, and expenses related to the realignment of business operations in relation to the precision aluminum and aluminum recycling business coupled with lower fixed cost absorption from lower revenue recorded. As a result, the gross profit margin declined to negative 1.4%. Management is closely monitoring the segment and taking operational initiatives to enhance its performance.
Other Income
Other income decreased by 47.3% to S$1.1 million in 1H25 from S$2.2 million in 1H24, primarily due to a favourable foreign exchange gain recorded in the previous year.
Selling, Distribution, Administrative and Other Operating Expenses
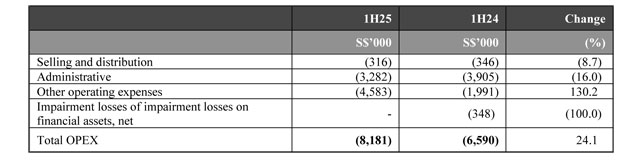
Total operating expenses (“OPEX”) increased by 24.1% to S$8.2 million in 1H25 from S$6.6 million in 1H24, mainly due to a foreign exchange loss in 1H25 arising from the weakening of USD-denominated assets against S$.
Selling and distribution expenses decreased slightly by 8.7% to S$0.3 million in 1H25 from S$0.35 million in 1H24. This reduction was mainly due to controlled entertainment expenses.
Administrative expenses decreased by 16.0% to S$3.3 million in 1H25 from S$3.9 million in 1H24. The previous period included higher staff-related expenses, whereas 1H25 benefited from cost optimization measures.
Other operating expenses more than doubled, increasing by 130.2% to S$4.6 million in 1H25 from S$2.0 million in 1H24. This significant increase was largely driven by unrealised foreign exchange losses on USD-denominated assets balances.
No impairment losses were recorded in 1H25, compared to S$0.35 million in 1H24. The prior year's impairment was primarily due to increased credit risk in the CP segment, which affected the value of contract assets.
Finance Costs
Finance costs increased by 16.6% to S$506,000 in 1H25, up from S$434,000 in 1H24. The increase was mainly attributable to increase utilisation of bank credit facilities during the period.
Share of Associate' Results
For 1H25 and 1H24, share of loss from associated company was insignificant.
Condensed Interim Statements of Financial Positions
As at 30 June 2025, the Group's non-current assets stood at S$172.4 million, significantly higher than S$66.0 million as at 31 December 2024. The increase was mainly attributable to:
- During the period, the Group acquired two new subsidiaries to support its growth. As a result, the assets and liabilities of these subsidiaries were consolidated into Group's financial statements. This led to increases in property, plant and equipment (including assets under construction), intangible assets from development costs, right-of-use assets for leased factories, and other receivables as of 30 June 2025.
- During the period, based on the recent transaction prices between knowledgeable and willing parties, a fair value gain of approximately S$6.14 million was recognised in Other Comprehensive Income (OCI).
As at 30 June 2025, the Group's current assets increased to S$122.2 million, up from S$111.4 million as at 31 December 2024. This growth was driven by several factors:
- Cash and bank balances remained stable at approximately S$38.1 million;
- Inventories rose to S$9.2 million, primarily due to raise up stock holdings within the Commodities segment;
- Increase in trade and other receivables mainly due to increase in E&C, Solar and Commodities segment;
- Contract assets recorded a moderate increase to S$11.6 million, consistent with the ongoing execution of projects; and
As at 30 June 2025, the Group's current liabilities increased significantly to S$99.0 million, compared to S$29.0 million as at 31 December 2024. The increase was primarily driven by:
- A substantial rise in trade and other payables to S$64.5 million from S$13.8 million, reflecting higher payables associated with increased business activities from the acquired subsidiaries;
- Contract liabilities increased to S$14.8 million, more than doubling from S$6.4 million, due to advance billings and progress payments received for ongoing projects;
As at 30 June 2025, the Group's non-current liabilities increased substantially to S$49.0 million, compared to S$6.4 million as at 31 December 2024. This increase was mainly attributable to:
- Recognition of other payables amounting to S$18.6 million, reflecting new long-term obligations in Commodities segment
- Introduction of deferred income of S$3.6 million, representing income received but not yet earned;
- Significant increase in term loans to S$23.6 million from S$2.8 million, mainly contributed by consolidation of the acquired subsidiaries.
Shareholders' equity increased marginally to S$142.7. million as at 30 June 2025 from S$140.0 million as at 31 December 2024. The increase was largely attributed to the fair value gain on investments in financial assets. This has partially offset the dividend payout S$1.74 million and loss for the period of S$1.981 million.
Condensed Interim Consolidated Statement of Cash Flows
During 1H25, the Group recorded a net cash outflow of S$3,000 due to: -
- Net cash from operating activities amounted to S$3.6 million, primarily due to improvement in working capital
- Net cash used in investing activities amounted to S$0.9 million in 1H25 mainly due to capital expenditure in EC, CP, Solar and Commodities segment.
- Net cash used in financing activities in 1H25 was mainly for the dividend payout of S$1.4 million and the repayment of trust receipts and term loan. This had partially offset with the new term loan and trust receipts drawdown during the period.
After taking into account the above net cash flows and net foreign currency translation adjustments, the Group's cash and cash equivalents as at 30 June 2025 stood at S$38.14 million.
Commentary
Singapore's ongoing focus on infrastructure development, including the expansion of the MRT network, new public housing projects, and smart city initiatives, is driving substantial demand in the construction sector. Major projects such as the Cross Island Line and the redevelopment of older town areas are creating significant opportunities for construction firms.
For the E&C segment, the steel engineering business is progressing steadily with its current portfolio of contracts. As we continue to fulfil our existing engineering steel contracts, our focus will gradually shift towards their successful completion as well as participating in the MRT network project.
The solar energy industry in Singapore is experiencing dynamic growth driven by strong government support, technological advancements, and a focus on urban solar solutions. The government's ambitious SolarNova Program aims to significantly increase solar capacity, while innovations in solar technology, such as bifacial panels and energy storage, are enhancing efficiency and reducing costs. The market is competitive, characterized by price pressures and a fragmented landscape with numerous local and international players. In the next 12 months, adapting to these factors will be crucial for maintaining competitiveness and leveraging new opportunities in Singapore's evolving solar energy sector.
For our Solar Energy segment, our initiatives in rooftop solar projects and the distribution of solar panels and related peripherals are poised for further enhancement. We continue to anticipate increasing demand, particularly in Singapore and Indonesia, and are capitalizing on growth opportunities within the renewable energy sector both domestically and globally. In addition, we are developing capabilities in battery energy storage systems as well as electric vehicle (EV) charging stations and maintenance services, which will complement our solar offerings and strengthen our integrated clean energy portfolio. While we remain prudent and refrain from immediate commitments to new large-scale solar development projects, we continue to actively explore opportunities to expand our portfolio in a sustainable and disciplined manner.
The corrosion prevention industry is evolving with significant trends including increased focus on advanced coatings and corrosion-resistant materials driven by stringent regulations and heightened environmental awareness. This sector is highly competitive, with key players offering a range of solutions from traditional protective coatings to innovative, high-tech materials that address the challenges of Singapore's humid and saline environment. This industry will continue to be influenced by factors such as potential regulatory updates concerning environmental and safety standards, fluctuations in raw material prices, and the ongoing demand for infrastructure maintenance and upgrades over the next 12 months.
On our CP segment, in light of the continuing rising costs, regulatory compliance, climate challenges, Technology Advancement to fight environmental issues and skilled work force are needed, we therefore need to continue to adopt a prudent approach in our order management strategy. Given the challenges posed by the competitive pricing, we will have to exercise caution in accepting additional orders to ensure effective management and sustained profitability.
Overall, while each segment will benefit from specific economic drivers, we will have to navigate challenges such as cost fluctuations and regulatory changes to maintain growth and competitiveness.